

Update, 1 October 2026. The furnishings figure in this strip, plus 0.4 per cent for July, was the published value when this ran. The ABS has since revised that month to plus 0.3 per cent, and revised three other recent months down as well. The figure is left as published, with the revisions set out here.
$3,976m
Residential alterations and additions, Mar 2026 quarter, seasonally adjusted, up 4.9% year on year
ABS Building Activity
+0.4%
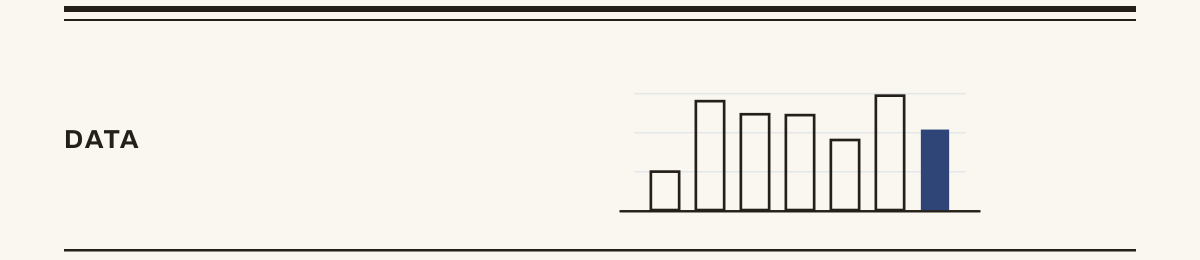
Furnishings and household equipment spending, July 2026, month on month, seasonally adjusted; a third straight monthly slowdown
ABS Monthly Household Spending Indicator
$904m
Estimated size of Australian window-covering manufacturing, 2025-26, shrinking 2.4% a year since 2021
IBISWorld estimate
570
Window-covering manufacturing businesses, 2026; the count has barely moved (+0.4% a year) while revenue fell
IBISWorld estimate
Demand: renovation activity keeps growing
Window coverings are bought when homes are built, renovated and refreshed. The ABS Building Activity series puts alterations and additions to residential buildings at $3,976.2 million for the March 2026 quarter in seasonally adjusted chain volume terms, up 4.1 per cent on the previous quarter and up 10.2 per cent on a year earlier. The smoother trend series agrees on direction and is calmer about the pace: $3,937.8 million, up 2.5 per cent on the quarter and 8.9 per cent on the year.
That is a real acceleration, and it is the reason this page has been rewritten rather than nudged. The edition we published on 5 July had this series growing at 4.9 per cent a year, and described renovation demand as growing at around 5 per cent annually. One quarter later the annual rate has roughly doubled. We do not have a published explanation for the step and we do not offer one; what we can say is that the quarter itself was strong on both measures, so this is not a base effect visible only in the year-on-year line.
We said in July that the March quarter figures would land on 8 July and that we would update this picture then. They did land that day, and that update was six weeks later than promised.
Correction, 28 August 2026. This page previously said the ABS does not publish a forward date on the release page, and inferred from cadence that the June 2026 quarter would appear in early October. It does publish one, under a "Future releases" heading, and we had simply not looked in the right place. The published date for Building Activity, June quarter 2026, is 7 October 2026. Our inference happened to be right, which is not the same as being sourced, so the date above is now the ABS's rather than ours.
Demand: households are still spending on furnishings
The monthly companion signal is the ABS Monthly Household Spending Indicator's "furnishings and household equipment" category, the basket window coverings sit inside. It rose 0.4 per cent in July 2026, seasonally adjusted, after 0.6 per cent in June and 0.8 per cent in May. That is three months of slowing growth in a row, and it is the first time this page has been able to say that: the category has been bumpy rather than directional every other time we have looked at it.
What makes the run worth noticing is that the total went the other way. Household spending reached $82.3 billion in July, up 1.1 per cent on the month and 7.0 per cent on a year earlier, which is a faster annual rate than the 6.0 per cent we reported for June. So furnishings is decelerating inside a total that is accelerating. We are not going to tell you why, because the ABS does not say and we will not guess. Three months is also short. But the direction of the gap is the thing to watch in the next two editions, because furnishings is the closest monthly proxy this industry has in public data.
One number moved that nobody announced. Total spending for June now reads 1.0 per cent month on month, where the edition we saved in August had it at 0.8, and May has gone from 1.3 to 1.2. The furnishings line for those two months has not been touched: May is still 0.8 and June still 0.6. So the revisions this time landed on the headline and left our category alone, which is worth knowing before quoting a month-old MHSI number back at anyone. We keep our own copies of each edition, and that is the only reason we can see it.
The monthly current-price numbers are the ones ABS leads with, but for a demand signal the quarterly volume measure is the better gauge, because it strips out price movement. On that basis furnishings and household equipment ran +3.1 per cent in the December 2025 quarter, −0.3 per cent in the March 2026 quarter and +1.7 per cent in the June 2026 quarter. So the category went backwards in real terms for a quarter and then recovered, which the monthly current-price line does not show you. That volume measure is quarterly, so July does not move it: the next reading covers the September quarter. The state split is where the month gets interesting:
Seasonally adjusted, month on month, July 2026. Source: ABS Monthly Household Spending Indicator, released 27 August 2026; percentage changes as published, read 28 August 2026. Bars share one scale; the vertical hairline is zero. The ACT is the only jurisdiction to fall this month, and the Northern Territory is exactly flat, so it has a label and no bar.
The ACT has now flipped three months running. It was the only jurisdiction to fall in May, at −0.1 per cent. It led the country in June at +2.1. In July it is the only one to fall again, at −0.6. Nothing about a territory of that size supports reading a trend into it, and we are pointing at it as a warning about the series rather than a finding about Canberra: a category this small, split eight ways, will produce a dramatic-looking chart every single month.
And we have to correct ourselves on the one claim we did make. The August edition of this page said NSW and Victoria, the two biggest covering markets, sat in the modest middle at +0.6 and +0.7 per cent, and called that the one steady thing in the series. Victoria has held at +0.7. NSW has not: it fell to +0.2 in July, second-weakest of the eight, ahead only of a flat Northern Territory and the falling ACT. Two months was not enough to call something steady, and we said it anyway. The honest version is that the largest market slowed hardest in the month the national category slowed for the third time, and that is worth a look in September rather than a conclusion now.
One month of a volatile category is weather, not climate. The reason to publish the split anyway is that it is the closest thing to a monthly, state-level demand gauge this industry has in public data.
Supply: the local manufacturing base is contracting
Against that firm demand backdrop, IBISWorld's industry report estimates window-covering manufacturing in Australia at $904.0 million for 2025-26, with revenue having declined at a compound 2.4 per cent a year between 2021 and 2026, import competition rated a high-impact force with "low-priced imports" contributing to the decline, and 570 businesses in the industry, a count growing just 0.4 per cent a year even as revenue fell. The largest operators, in IBISWorld's naming, are Hunter Douglas, Windoware and Dollar Curtains & Blinds. These are a commercial research firm's estimates, not official statistics, and we attribute them as such; no ABS series measures this industry directly.
What the triangulation means for a buyer
Put the three series together and the picture is: demand for window coverings is growing, and an increasing share of it is being met by imports rather than the local manufacturing base. For a buyer that has two practical edges. First, "Australian made" is a shrinking, not growing, share of what showrooms offer, so if local manufacture matters to you, it is worth asking rather than assuming. Second, a growing-demand, consolidating-supply market is one where quotes vary widely for equivalent product; the same conditions that squeeze local makers reward buyers who compare. We note the industry body, WSAA, actively campaigns on Australian-made manufacturing; that advocacy is part of this landscape and is attributed as advocacy.